
Understanding INP’s Technical Foundation
Interaction to Next Paint measures the latency of every user interaction on a page—clicks, taps, and keyboard inputs—and reports the longest delay (or near-longest for pages with many interactions). Unlike FID, which only captured the delay of the first interaction, INP provides a comprehensive view of responsiveness throughout the entire page lifecycle.
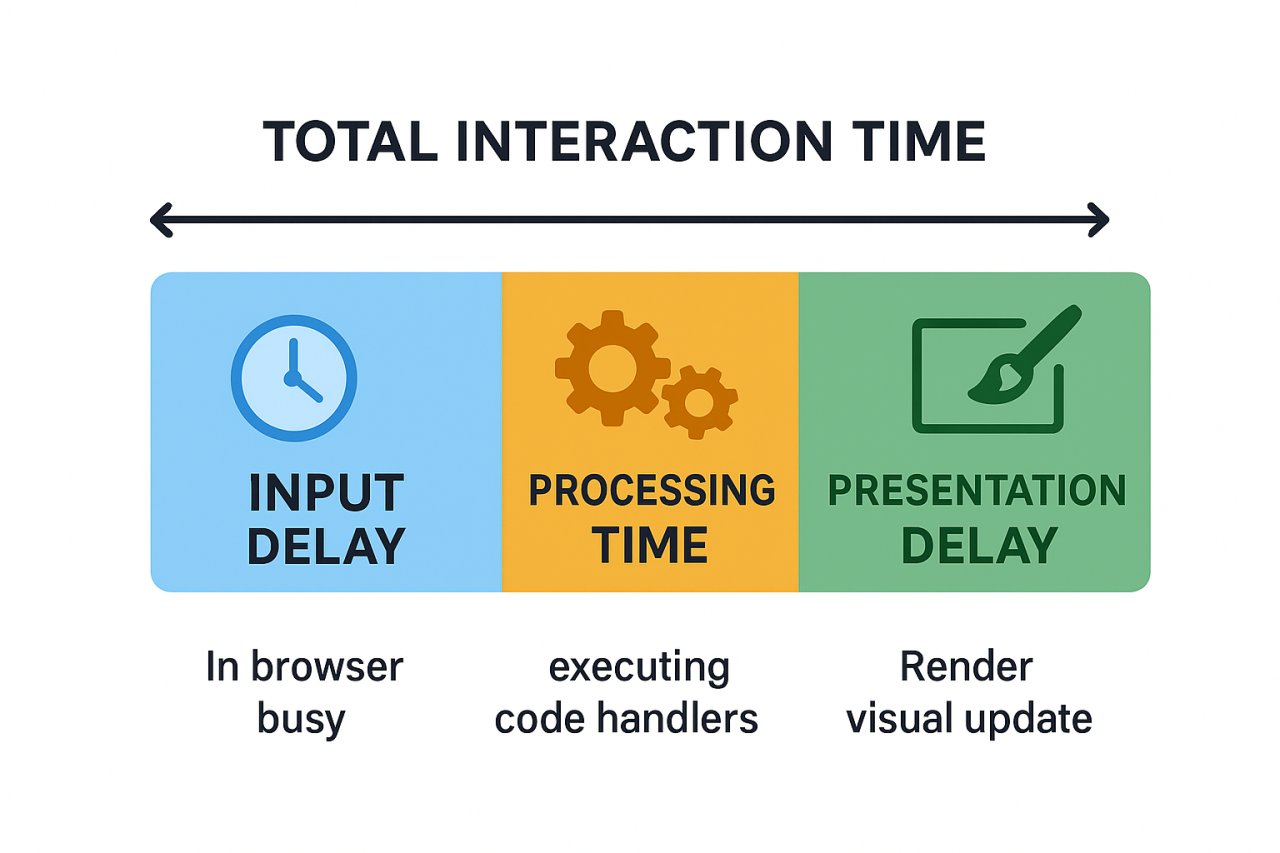
The metric considers the entire duration from when a user initiates an interaction until the browser paints the next frame showing visual feedback. This includes input delay, processing time, and presentation delay. Google considers an INP of under 200ms as “good,” between 200-500ms as “needs improvement,” and above 500ms as “poor.”
The data reveals significant real-world impact: according to Chrome UX Report statistics, approximately 65% of page visits currently achieve good INP scores, compared to 90%+ that passed FID. This dramatic difference exposes responsiveness issues that FID never detected, making INP optimization a critical priority for technical SEO professionals.
Why FID Was Insufficient
FID’s limitation was its narrow focus on the first interaction only. A page could have terrible responsiveness throughout the user journey but still pass FID if that initial click happened during an idle period. Real user monitoring data consistently showed that subsequent interactions often experienced worse delays than the first one, especially as JavaScript execution ramped up and the main thread became increasingly busy.
INP addresses this by sampling interactions throughout the session, ultimately reporting the 98th percentile of interaction latency. For pages with 50 or fewer interactions, it reports the worst one. This methodology ensures that consistently poor responsiveness cannot hide behind a single lucky fast interaction.
Technical Architecture of Interaction Delays
To optimize INP effectively, you must understand the three phases that contribute to interaction latency. Each phase presents distinct optimization opportunities and challenges.
Input Delay Phase
This is the time between user input and when event handlers begin executing. Input delay occurs primarily because the main thread is busy with other work—typically long JavaScript tasks that block the thread for extended periods. The browser cannot respond to user input while executing these tasks.
Measurements from WebPageTest show that pages with long tasks exceeding 50ms consume 40-70% of total INP time in input delay alone. Breaking these long tasks into smaller chunks is fundamental to reducing this phase.
Processing Time
This covers the actual execution of event handlers, callbacks, and any synchronous work triggered by the interaction. Complex event listeners that perform heavy computations, DOM manipulations, or synchronous API calls can create substantial processing delays.
Profiling data indicates that unnecessary re-renders and forced synchronous layouts frequently contribute 100-300ms to processing time. Tools like Chrome DevTools Performance panel reveal these bottlenecks through flame charts that visualize exactly which functions consume the most time.
Presentation Delay
After processing completes, the browser must render and paint the visual update. This includes style recalculation, layout, and paint operations. Large DOM trees, complex CSS selectors, and extensive layout shifts can inflate presentation delay significantly.
Real-world audits show that pages with DOM trees exceeding 1,500 nodes experience presentation delays 2-3x higher than streamlined pages. CSS containment and content-visibility properties offer powerful tools for limiting render scope.
Advanced Measurement and Debugging Strategies
Accurate measurement forms the foundation of effective INP optimization. Multiple tools and techniques provide complementary insights into interaction performance.
Chrome User Experience Report Integration
CrUX data reflects real-world INP performance from actual Chrome users. Accessing this through PageSpeed Insights API or BigQuery allows you to track INP across different dimensions—device types, connection speeds, and geographic regions. Enterprise sites typically see mobile INP scores 150-250ms worse than desktop due to CPU constraints.
The CrUX API provides 75th percentile values for origin-level and URL-level metrics. Monitoring these over time reveals whether optimizations improve real user experience. Set up automated tracking to alert when INP degrades beyond thresholds.
Real User Monitoring Implementation
RUM tools like Sentry, LogRocket, and SpeedCurve capture INP from your actual users with full context about which specific interactions caused poor scores. The web-vitals JavaScript library from Google provides easy implementation:
Implement attribution data collection to identify problematic event handlers. The library exposes which element triggered the slow interaction, the interaction type, and timing breakdown across the three phases. This granular data pinpoints exactly where optimization efforts should focus.
Lab Testing with Chrome DevTools
The Performance panel’s Interactions track shows all interactions with their durations. Enable CPU throttling (4x slowdown) to simulate mid-range mobile devices where INP problems manifest most severely. Record interactions and analyze the flame chart to identify long tasks, forced layouts, and excessive JavaScript execution.
The Rendering panel’s “Paint flashing” option visualizes which screen areas repaint during interactions. Minimizing paint area reduces presentation delay. The “Layout Shift Regions” overlay reveals unstable elements that might trigger unexpected reflows.
Proven Optimization Techniques
Systematic INP improvement requires addressing each phase with targeted technical interventions. The following strategies demonstrate measurable impact across diverse site architectures.
Breaking Up Long Tasks
Long tasks are the primary cause of input delay. Any JavaScript execution exceeding 50ms blocks the main thread and prevents timely interaction responses. The solution involves yielding to the main thread between chunks of work.
The scheduler.yield() API provides optimal yielding behavior, but requires a polyfill for broader support. Alternatively, setTimeout with 0ms delay allows the browser to process pending interactions. A major e-commerce platform reduced INP from 520ms to 180ms by chunking their product filter update logic using this technique.
For computationally intensive operations, consider Web Workers for off-thread processing. Analytics processing, data transformations, and complex calculations can execute in workers without blocking interactions. A news site moved their article recommendation algorithm to a worker and saw INP improve by 200ms.
Debouncing and Throttling Input Handlers
Rapid-fire events like scroll, resize, and input can trigger handlers dozens of times per second. Each execution queues work on the main thread. Implementing debouncing ensures handlers execute only after input pauses, while throttling limits execution frequency.
A real estate search site had scroll handlers firing on every scroll event to implement infinite scroll. Throttling to every 200ms reduced INP by 180ms while maintaining functionality. Use requestAnimationFrame for visual updates to synchronize with the browser’s render cycle.
Code Splitting and Lazy Loading
Reducing initial JavaScript payload decreases parse and compile time, making the main thread more available for interactions. Implement route-based and component-based code splitting to load only necessary code for each page.
Webpack and Vite provide automatic code splitting through dynamic imports. A SaaS dashboard reduced main thread blocking time by 1.2 seconds by lazy-loading admin panel features. This translated to INP improvements of 150-200ms across administrative pages.
Optimizing Third-Party Scripts
Tag managers, analytics, ads, and social widgets frequently introduce long tasks that degrade INP. Audit third-party impact using the Coverage panel in DevTools and the Third-Party Web tool. Consider these strategies:
- Delay non-critical scripts until after key interactions complete using requestIdleCallback
- Implement facade patterns for embedded widgets—load full widgets only after user interaction
- Use Partytown to run third-party scripts in web workers, isolating them from the main thread
- Establish performance budgets for third parties and remove or replace chronic offenders
A publishing site moved Google Analytics and ad scripts to Partytown and measured INP improvement from 380ms to 220ms during article reading interactions.
Framework-Specific Considerations
Modern JavaScript frameworks introduce unique INP challenges related to their rendering and state management approaches.
React Optimization Patterns
React’s reconciliation process can create processing delays when components re-render unnecessarily. Use React.memo to prevent unnecessary renders, useMemo for expensive calculations, and useCallback for stable function references.
The startTransition API marks updates as non-urgent, allowing React to prioritize user interactions. A data-intensive dashboard wrapped expensive state updates in startTransition and reduced INP from 450ms to 210ms for filter interactions.
Implement virtualization for long lists using react-window or react-virtual. Rendering thousands of DOM nodes creates massive processing and presentation delays. Virtualization renders only visible items, dramatically reducing render work.
Next.js and Server Components
Next.js Server Components shift rendering to the server, reducing client-side JavaScript and improving INP. Convert static components to Server Components to eliminate their client-side rendering cost.
The App Router’s streaming capabilities allow progressive hydration, making pages interactive faster. A content site migrating to Server Components saw average INP decrease by 180ms while maintaining functionality.
Vue and Composition API
Vue’s reactivity system can trigger excessive re-computation if dependencies aren’t properly managed. Use computed properties judiciously and implement shallow reactive references for large data structures.
The v-once directive renders elements once without reactivity tracking, useful for static content. A form-heavy application applied v-once to informational sections and improved form interaction INP by 120ms.
CSS and Rendering Optimization
Presentation delay stems largely from rendering work. Strategic CSS optimization minimizes this phase.
CSS Containment
The contain property tells browsers which elements are isolated from the rest of the document. This allows the browser to limit style recalculation and layout scope. Apply contain: content to widgets, cards, and independent components.
A social media feed implemented containment on post cards and reduced presentation delay by 80-120ms for like/comment interactions. The browser no longer recalculated layout for the entire feed when a single card changed.
Content Visibility
The content-visibility: auto property enables the browser to skip rendering work for off-screen content. This dramatically reduces initial render time and subsequent layout calculations.
Apply to sections below the fold, collapsed accordions, and hidden tabs. A documentation site added content-visibility to code examples and measured INP improvements of 100ms for tab switching interactions.
Monitoring and Continuous Improvement
INP optimization requires ongoing attention as code evolves and third-party dependencies update. Establish systematic monitoring and governance.
Performance Budgets
Define maximum acceptable INP values for different page types and interaction categories. Critical user flows should target INP under 150ms, while less frequent interactions might accept 200ms. Use Lighthouse CI and performance-budget tools to fail builds that exceed budgets.
Regression Detection
Integrate INP measurement into CI/CD pipelines using tools like Calibre, SpeedCurve, or WebPageTest API. Automated testing catches regressions before production deployment. One enterprise team prevented 12 INP regressions over six months using automated performance testing.
A/B Testing Impact
Measure INP impact of new features and optimizations through controlled experiments. Google Optimize and VWO enable splitting traffic and comparing Core Web Vitals metrics. This data-driven approach validates optimization investments and guides prioritization.
INP optimization represents a continuous technical discipline rather than a one-time project. As user expectations evolve and Google potentially tightens thresholds, maintaining excellent responsiveness becomes increasingly critical for search visibility and user satisfaction. The sites that systematically address long tasks, optimize rendering, and monitor real user experience will maintain competitive advantages in both organic rankings and conversion performance.