
Understanding the Technical Mechanics of INP
INP measures the latency of all user interactions throughout a page’s lifecycle, not just the first one. While FID only captured initial click delays, INP evaluates every click, tap, and keyboard interaction to determine how quickly the browser responds with visual feedback.
The metric works by observing the entire duration from user input to the next frame paint. This includes input delay, processing time, and presentation delay. Google calculates INP by examining all interactions on a page and reporting the 98th percentile value, meaning it captures the worst experiences for nearly all users while discounting outliers.
Good INP scores fall below 200ms, needs improvement ranges from 200-500ms, and anything above 500ms is considered poor. These thresholds are significantly stricter than FID’s 100ms benchmark, reflecting the more comprehensive nature of the measurement.
Why INP Captures Real User Experience Better
FID measured only the first interaction delay, which often occurred during page load when users simply clicked a navigation link. This interaction typically required minimal JavaScript processing. INP, however, captures interactions like:
- Accordion expansions that trigger complex DOM manipulations
- Form submissions with validation logic and API calls
- Dynamic filter applications on e-commerce category pages
- Interactive map interactions requiring heavy computation
- Modal openings with animation sequences
This comprehensive approach reveals performance bottlenecks that FID consistently missed. A site could have excellent FID scores while delivering frustrating experiences during actual product browsing or form completion.
Measuring INP Across Your Technical Stack
Effective INP optimization requires multi-layered measurement using both lab and field data. Chrome User Experience Report (CrUX) provides the official field data that Google uses for ranking signals, but it only updates monthly and requires sufficient traffic volume.
PageSpeed Insights now prominently displays INP in both its field and lab data sections. The lab data uses Total Blocking Time (TBT) as a proxy since INP requires real user interactions. While TBT doesn’t directly correlate to INP, reducing it generally improves interaction responsiveness.
Real User Monitoring Implementation
Implementing the web-vitals JavaScript library provides granular INP tracking with interaction attribution. The library exposes which specific interactions caused poor INP scores, the elements clicked, and the processing breakdown:
The attribution data reveals whether delays stem from input processing, event handlers, or rendering work, enabling targeted optimization.
Tools like DebugBear, SpeedCurve, and Treo offer specialized INP monitoring with historical trending, percentile distributions, and interaction-level drill-downs. These platforms typically segment data by device type, connection speed, and geographic region to identify affected user segments.
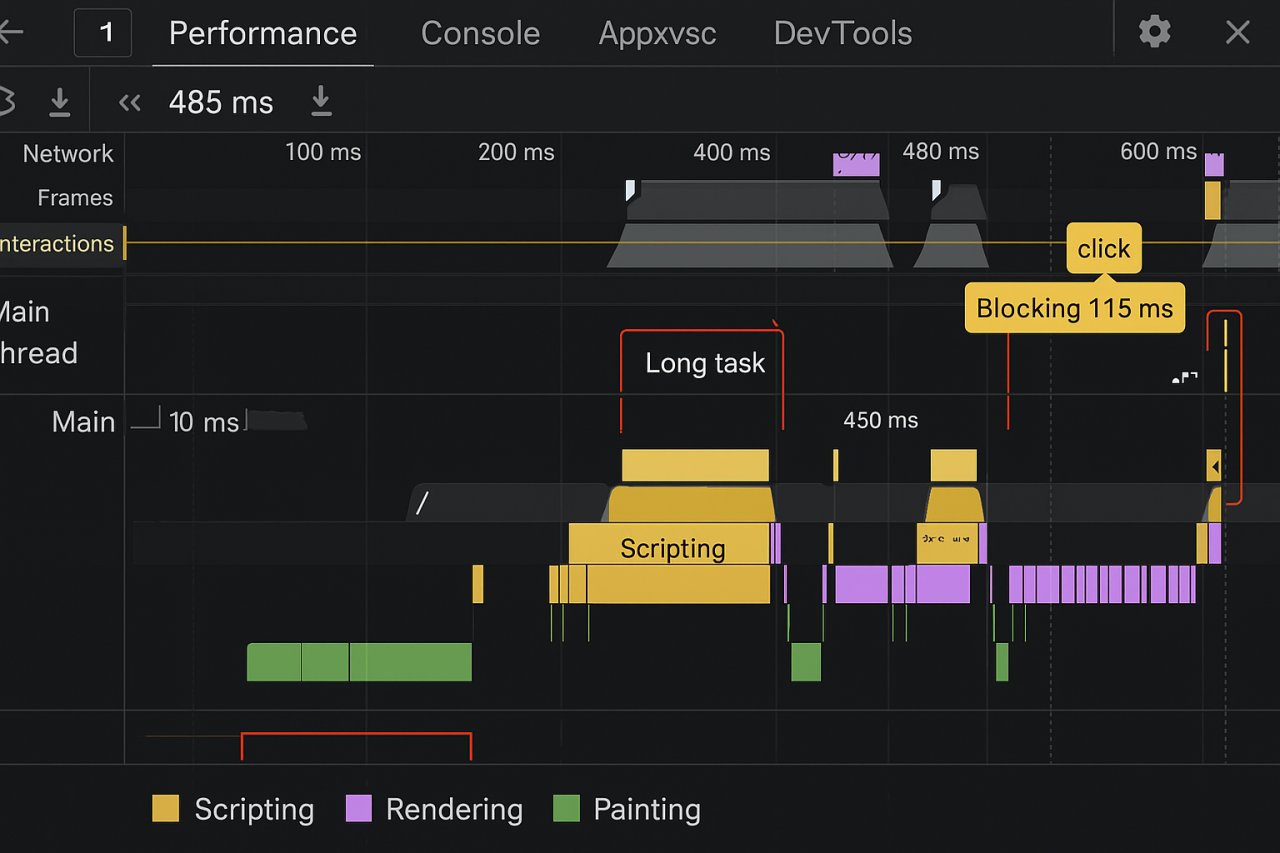
Chrome DevTools introduced an Interactions track in the Performance panel specifically for INP debugging. Recording a performance profile while interacting with your page reveals the exact functions consuming processing time and blocking the main thread.
Technical Optimization Strategies for Runtime Performance
Optimizing INP differs fundamentally from traditional load performance work. While LCP optimization focuses on initial rendering, INP requires runtime efficiency throughout the entire user session.
JavaScript Execution Budget Management
The primary culprit behind poor INP is long-running JavaScript that blocks the main thread. Modern frameworks often execute substantial work in response to user interactions, preventing the browser from painting visual feedback.
Implementing code splitting with dynamic imports ensures that interaction handlers only load necessary code. An e-commerce filter system might initially load minimal JavaScript, then fetch additional modules only when users interact with specific filter types.
Debouncing and throttling remain essential for high-frequency interactions. Search autocomplete features should debounce input events to avoid triggering API calls and DOM updates on every keystroke. A 150ms debounce reduces processing work while maintaining perceived responsiveness.
Optimizing Third-Party Script Impact
Analytics tools, advertising pixels, and chat widgets frequently degrade INP by competing for main thread time. A detailed analysis of a major retail site revealed that Google Tag Manager alone contributed 180ms to INP during add-to-cart interactions.
Partytown offers a compelling solution by relocating third-party scripts to a web worker, preventing them from blocking main thread interactions. Implementation requires updating script loading patterns and may require adjustments for scripts needing DOM access.
The requestIdleCallback API enables strategic scheduling of non-critical work during browser idle periods. Deferring analytics beacons and non-essential tracking until after interaction completion can significantly reduce INP impact.
Framework-Specific Optimization Approaches
Different JavaScript frameworks present unique INP challenges requiring tailored optimization strategies.
React Performance Patterns
React applications often suffer from excessive re-renders triggered by state changes. A form with multiple inputs might re-render the entire component tree on each keystroke, creating substantial processing delays.
Implementing React.memo for component memoization prevents unnecessary re-renders when props remain unchanged. An e-commerce filter sidebar wrapped in React.memo only updates when filter selections actually change, not on unrelated state updates.
The useTransition hook introduced in React 18 marks updates as non-urgent, allowing the browser to prioritize user interactions. Applying useTransition to search filtering enables React to interrupt rendering work if the user initiates another interaction.
React Server Components fundamentally shift processing from the client to the server, reducing JavaScript execution required for interactions. A product listing page built with RSC delivers interactive elements without shipping the data-fetching logic to the browser.
WordPress and jQuery Optimization
WordPress sites frequently exhibit poor INP due to accumulated jQuery dependencies and plugin conflicts. Each plugin potentially adds event listeners and DOM manipulation code that executes on user interactions.
A comprehensive audit of a WordPress news site revealed 37 separate event listeners attached to navigation elements, with many performing redundant work. Consolidating these into a single delegated event handler reduced INP by 210ms.
Replacing jQuery-dependent plugins with vanilla JavaScript alternatives eliminates the framework overhead. Modern browser APIs for DOM manipulation and event handling perform significantly faster than jQuery abstractions.
Advanced Implementation: Task Yielding
Task yielding represents the most powerful technique for improving INP on interaction-heavy pages. The strategy involves breaking long tasks into smaller chunks that yield control back to the browser between segments.
The scheduler.yield() API provides an explicit yielding mechanism. When processing a large dataset after a user interaction, periodically calling scheduler.yield() ensures the browser can respond to subsequent inputs:
By yielding every 50ms during processing, applications maintain responsiveness even during computationally intensive operations.
An image gallery site processing hundreds of thumbnails after filter application implemented yielding between batches. INP improved from 670ms to 185ms while maintaining identical functionality.
Strategic Yielding Patterns
Not all code sections benefit equally from yielding. The technique works best for:
- Large list rendering operations exceeding 50 DOM elements
- Data processing loops iterating over substantial datasets
- Complex calculations requiring multiple processing steps
- Sequential API calls with intermediate processing
Yielding introduces minimal overhead but can fragment execution flow, requiring careful implementation to maintain code maintainability and logical coherence.
Real-World INP Optimization Results
A major e-commerce platform reduced INP from 520ms to 165ms through systematic optimization. The primary interventions included:
Migrating product filtering logic from client-side processing to server-side API endpoints, reducing JavaScript execution by 280ms. The filter interface now sends selected parameters to the backend rather than processing the entire catalog locally.
Implementing virtual scrolling for product grids limited DOM elements to visible items plus a buffer zone. This reduced interaction processing time by eliminating unnecessary event listeners and layout calculations for off-screen products.
Decomposing the add-to-cart interaction into phases with immediate visual feedback before completing backend processing. Users see the cart icon update within 100ms while inventory checks and analytics tracking complete asynchronously.
Content-Heavy Site Transformation
A digital publishing platform struggling with 710ms INP on article pages identified lazy-loaded ad units as the primary bottleneck. Each scroll interaction triggered bidding processes for newly visible ad slots, blocking the main thread.
Restructuring ad loading to use Intersection Observer with longer margins initiated bidding before ads entered the viewport. Combined with ad slot pre-rendering during idle time, INP dropped to 230ms while maintaining identical ad revenue.
Monitoring INP Impact on Search Performance
Google Search Console now reports Core Web Vitals with INP replacing FID, but the lag time between implementation and ranking impact requires patience. CrUX data collection spans 28 days, meaning optimizations need sustained performance improvements to affect rankings.
A financial services site documented a 23% increase in organic traffic over three months following comprehensive INP optimization. The correlation aligned with improved rankings for competitive keywords where multiple sites offered comparable content quality.
Segmenting performance by page template reveals which site sections require optimization priority. E-commerce sites typically see category pages with poor INP due to filtering interactions, while blog content maintains better scores with minimal interactive elements.
Preparing for Future Interaction Metrics
Google’s shift toward interaction-focused metrics signals continued evolution of performance measurement. The Chrome team actively explores additional responsiveness signals including interaction latency histograms and animation smoothness metrics.
Implementing comprehensive performance budgets for interaction latency ensures ongoing optimization rather than reactive fixes. Establishing a 150ms budget for critical interactions like add-to-cart or form submission prevents performance regression during feature development.
The Performance Observer API enables automated alerting when INP degrades beyond acceptable thresholds. Integrating these alerts into deployment pipelines catches performance regressions before they impact real users or search rankings.
INP optimization fundamentally requires shifting from load-time thinking to runtime performance consciousness. Sites that embrace this perspective and implement systematic measurement and optimization will maintain competitive advantage as Google continues emphasizing user experience quality in ranking algorithms.